The following is in response to the commentary, Sixteen Cents: Pushing the Unstable Limits of Monetary Policy, by John P. Hussman, which appeared on January 24.
Dear Editor:
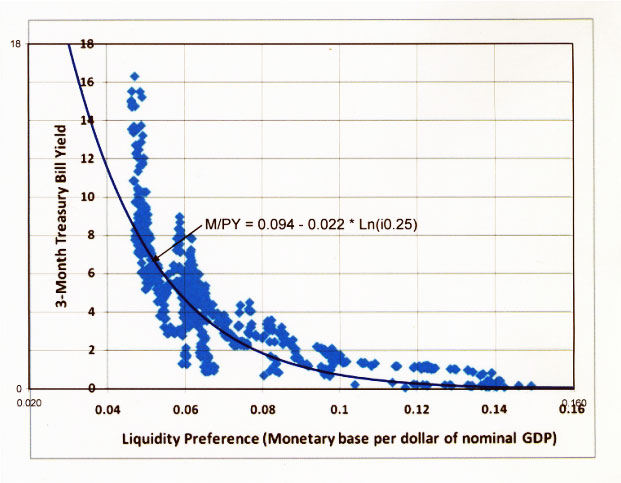
This commentary discusses the relationship between the three-month Treasury bill yield, the liquidity preference for base money and the GDP deflator. The author shows mathematically that once the Fed has concluded its planned purchases under QE2, resulting in the monetary base increasing from $2,000 to $2,400 billion, it will require a decline in three-month Treasury bill yields to 0.05% in order to avoid inflationary pressure.
The mathematics are based entirely on the liquidity preference function, which is defined more specifically as the amount of base money demanded per dollar of nominal GDP and is given in the commentary as:
M/PY = .094 - .022 * ln(i.025)
where,
M = monetary base, PY = nominal GDP, P = GDP deflator, Y = real GDP in 2005 dollars and i0.25 = three-month Treasury bill yield.
This function is supposed to be the regression line or best-fit line of the data set depicted in the first chart of the commentary. Goodness-of-fit statistics and confidence bands to confirm the appropriateness of the fitted regression function are not presented. The chart is reproduced below with the M/PY function superimposed over the data points. From visual inspection, it is evident that the function does not hold for i0.25 greater than 8% and for i0.25 less than 1%. The tail end of the function, the region where the function is most unreliable, is used by the author to support his various conclusions.
One can produce many curves that fit the data as badly as this M/PY function does and make them pass through the data point of i0.25= 0.15% and M/PY= 2000/14900= 0.134, while simultaneously fulfilling the requirement that P= 1.10 for M= 2000 and Y= 13409, (M and Y are the expected values at the end of 2010 and P is the most recent published GDP deflator). Some curves may have a much flatter slope at their tail ends, which obviously would produce a higher value of i0.25 at M/PY= 2400/14900= 0.161, thus negating the inflation argument presented.
Confidence bands would also illuminate the inappropriateness of using any function in the region where i0.25 tends to zero.
Sincerely,
Georg Vrba, P.E.


